



Minotaur
Monthly
Monthly
October 2026
Performance
| Period | Minotaur | MSCI AC World | Alpha |
|---|---|---|---|
| 1 Month | -1.8% | -2.7% | +0.9% |
| 3 Months | +0.1% | -0.3% | +0.4% |
| 6 Months | +8.3% | +6.5% | +1.8% |
| 1 Year | +3.6% | +4.5% | -1.0% |
| Inception (p.a.) | +17.0% | +14.3% | +2.7% |
Commentary
Portfolio
Top 10 Holdings
(alphabetical)
.png)
Artrya Limited
Artrya is an Australian medtech company using AI to diagnose coronary artery disease. Its Salix platform applies deep learning to coronary CT scans, automatically detecting high-risk arterial plaque and assessing blood flow in near real-time to enable faster, more accurate diagnosis at the point of care.
Australia
Health Care
Small Cap

.png)
CD Projekt Red S.A.

CD Projekt is a Polish video game developer, best known for their immersive, story-driven RPG games. Their flagship titles, The Witcher series and Cyberpunk 2077, have captivated millions of players worldwide. With a focus on creating unforgettable characters and rich, detailed worlds, CD Projekt continues to push the boundaries of interactive storytelling.

Poland
Communication Services
Mid Cap
.png)
Crocs, Inc.
Crocs is an American footwear brand built around its iconic foam-resin clogs. Once a polarising fashion statement, it has become a cultural phenomenon through customisable Jibbitz charms and high-profile collaborations with celebrities, designers and lifestyle brands. The line now extends to sandals, slides and other casual footwear.

United States
Consumer Discretionary
Mid Cap

.png)
Eli Lilly and Company
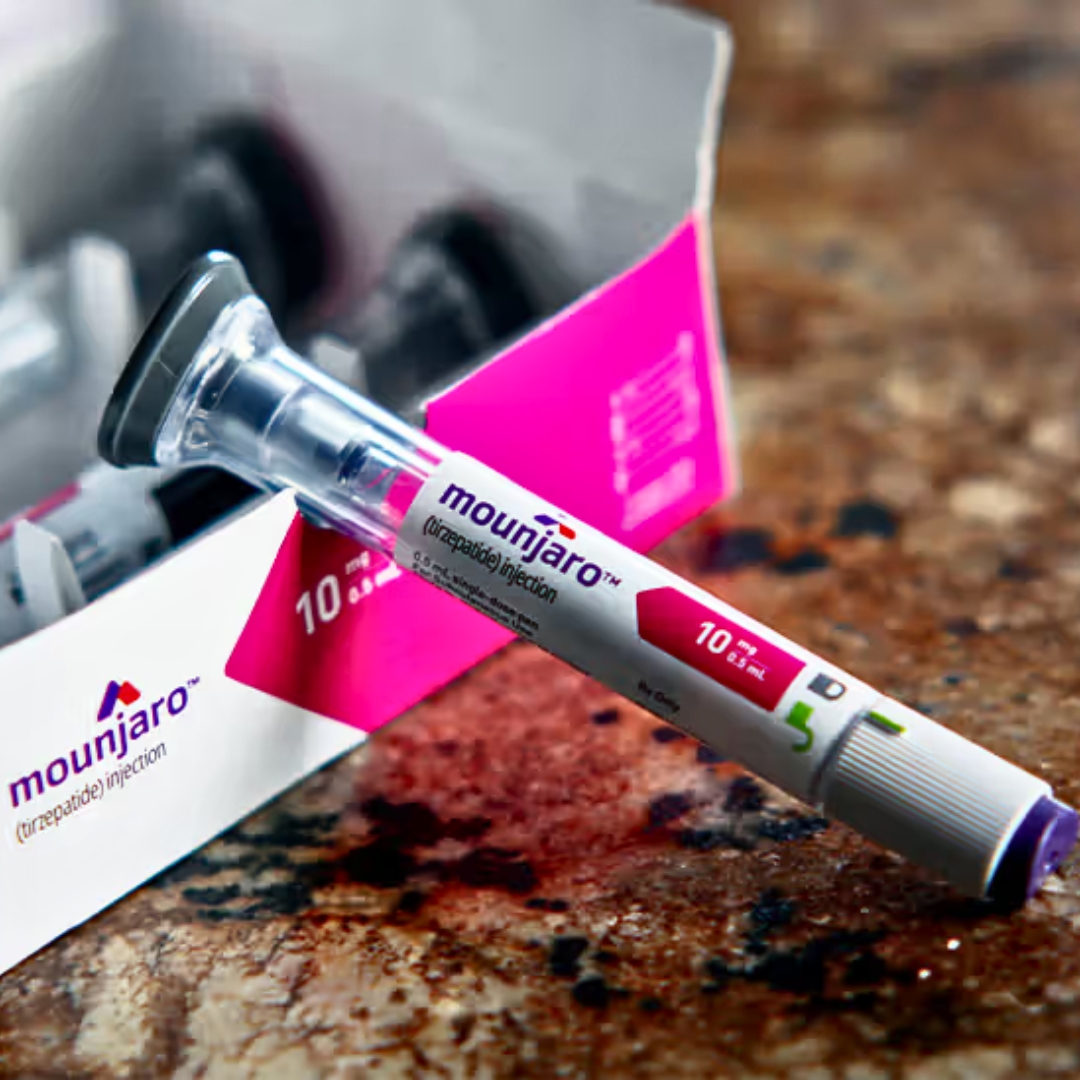
Eli Lilly is a leading American pharmaceutical company with a heritage spanning over 140 years. Specialising in treatments for diabetes, oncology, and neuroscience, the company has become a dominant force in the rapidly growing GLP-1 market with its tirzepatide products, Mounjaro and Zepbound. With continued innovation in metabolic disease and Alzheimer's treatments, Eli Lilly is positioned at the forefront of modern medicine's most transformative therapeutic areas.
United States
Health Care
Mega Cap
Freee K.K.
freee is a Japanese cloud software company that makes accounting, payroll and HR tools for small businesses. By connecting to bank accounts and credit cards, it automates bookkeeping, invoicing and tax filing, work many Japanese businesses still do on paper.

Japan
Information Technology
Small Cap

.png)
HCA Healthcare Inc.

HCA Healthcare is the largest private hospital operator in the United States, running around 190 hospitals and more than 2,000 ambulatory care sites across 20 states and the United Kingdom. Its scale gives it meaningful advantages in purchasing, nurse staffing, and payer negotiations, supporting industry-leading margins. With an ageing population driving steadily rising demand for healthcare services, HCA combines defensive growth with disciplined capital returns through buybacks and dividends.
United States
Health Care
Large Cap
.png)
Meta Platforms Inc Class A
Meta Platforms owns Facebook, Instagram, WhatsApp and Messenger, used by more than three and a half billion people every day. It's one of the world's largest advertising businesses, using AI to show each person the ads most relevant to them. Meta is now investing heavily in AI, and its new Muse agent can browse, book and buy on a user's behalf.
United States
Communication Services
Mega Cap

.png)
NVIDIA Corporation

NVIDIA is a global leader in AI hardware and software, best known for its powerful GPUs that have revolutionised gaming, professional visualization, and high-performance computing. With cutting-edge technologies like ray tracing and deep learning, NVIDIA is driving innovation in fields from self-driving cars to scientific research.
United States
Information Technology
Mega Cap
.png)
SK hynix Inc.
SK hynix is a South Korean semiconductor giant and one of the world's largest manufacturers of memory chips, including DRAM and NAND flash. The company has emerged as the dominant supplier of high-bandwidth memory (HBM), the specialised chips stacked alongside NVIDIA's GPUs to feed data into AI accelerators, making SK hynix a critical link in the global AI infrastructure supply chain.

South Korea
Information Technology
Mega Cap
.png)
UniCredit S.p.A.
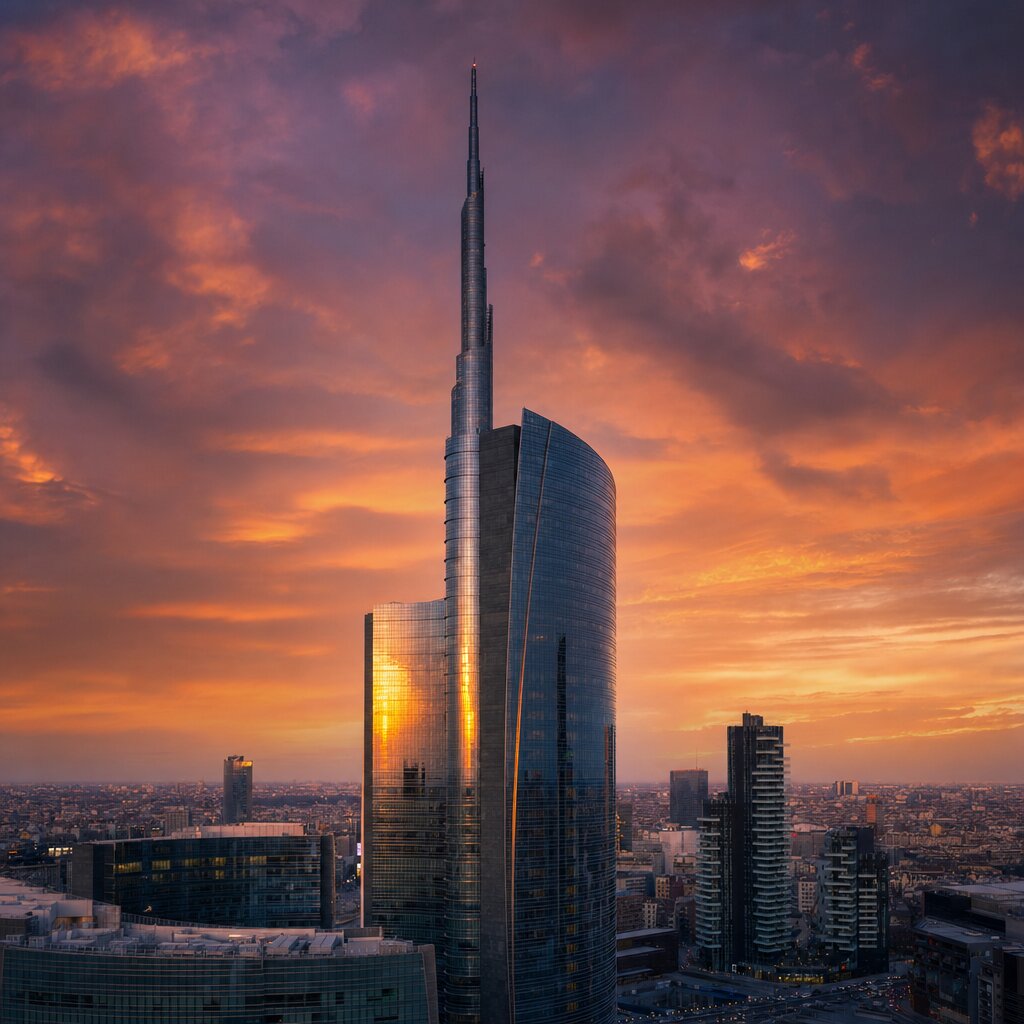
UniCredit is one of Europe's largest banking groups, headquartered in Milan with strong franchises in Italy, Germany and Central and Eastern Europe. It serves retail, corporate and institutional clients across commercial, investment and wealth-management businesses, with digital investment lifting customer experience and operational efficiency across its pan-European network.

Italy
Financials
Large Cap
Market Cap
Mega Cap
US$200bn+
23.9%
Large Cap
US$10-200bn
33.3%
Mid Cap
US$2-10bn
16.7%
Small Cap
US$300m-2bn
15.8%
Micro Cap
Under US$300m
1.7%
Invested Position
Gross Long
95.9%
Gross Short
4.6%
Net Exposure
91.4%
Long Positions
66
Short Positions
5
Regions
North America
49.8%

United States
47.8%

Canada
2.0%
Europe
15.1%

Italy
4.4%

Poland
3.4%

United Kingdom
2.9%

France
1.3%

Germany
1.3%

Denmark
0.9%

Spain
0.8%
Asia Pacific
26.5%

South Korea
8.5%

Japan
6.7%

Hong Kong
4.2%

Australia
4.0%

Singapore
2.3%

Taiwan
0.6%

Indonesia
0.2%
Sectors
Energy
4.5%
Materials
0.9%
Industrials
4.8%
Consumer Discretionary
7.8%
Consumer Staples
3.3%
Health Care
11.8%
Financials
14.1%
Information Technology
19.9%
Communication Services
20.4%
Utilities
4.0%
Real Estate
0.0%
Interested in Minotaur Capital?
Subscribe to receive monthly performance updates and quarterly commentary.
© 2024 Minotaur Capital Management Pty Ltd (Minotaur). All rights reserved. See our Privacy Policy.
Minotaur Capital Management Pty Ltd (ABN 17 672 819 975) is a corporate authorised representative (CAR 1308265) of Minotaur Licensing Pty Ltd (ABN 86 674 743 198) (AFSL 557080). The Minotaur Global Opportunities Fund is issued by K2 Asset Management Ltd (ABN 95 085 445 094, AFSL 244393), a wholly owned subsidiary of K2 Asset Management Holdings Ltd (ABN 59 124 636 782).
The information in this website (the Information) has been prepared by Minotaur.
For keyboard shortcuts, press ?
This information is for general information only and is not an offer for the purchase or sale of any financial product or services. The Information has been prepared for investors who qualify as wholesale clients under section 761G of the Corporations Act 2001 (Cth) (Corporations Act) or to any other person who is not required to be given a regulated disclosure document under the Corporations Act. The Information is not intended to provide you with financial or tax advice and does not take into account your objectives, financial situation or needs. Although we believe that the Information is correct, no warranty of accuracy, reliability or completeness is given, except for liability under statute which cannot be excluded. Please note that past performance may not be indicative of future performance and that no guarantee of performance, the return of capital or a particular rate of return is given Minotaur, K2 Asset Management or any other person. To the maximum extent possible, Minotaur, K2 Asset Management or any other person do not accept any liability for any statement in this Information.
Minotaur Capital Management Pty Ltd (ABN 17 672 819 975) is a corporate authorised representative (CAR 1308265) of Minotaur Licensing Pty Ltd (ABN 86 674 743 198) (AFSL 557080). The Minotaur Global Opportunities Fund is issued by K2 Asset Management Ltd (ABN 95 085 445 094, AFSL 244393), a wholly owned subsidiary of K2 Asset Management Holdings Ltd (ABN 59 124 636 782).
The information in this website (the Information) has been prepared by Minotaur.
For keyboard shortcuts, press ?
This information is for general information only and is not an offer for the purchase or sale of any financial product or services. The Information has been prepared for investors who qualify as wholesale clients under section 761G of the Corporations Act 2001 (Cth) (Corporations Act) or to any other person who is not required to be given a regulated disclosure document under the Corporations Act. The Information is not intended to provide you with financial or tax advice and does not take into account your objectives, financial situation or needs. Although we believe that the Information is correct, no warranty of accuracy, reliability or completeness is given, except for liability under statute which cannot be excluded. Please note that past performance may not be indicative of future performance and that no guarantee of performance, the return of capital or a particular rate of return is given Minotaur, K2 Asset Management or any other person. To the maximum extent possible, Minotaur, K2 Asset Management or any other person do not accept any liability for any statement in this Information.
The Minotaur Global Opportunities Fund returned -1.8% in October, 0.9ppts ahead of the MSCI ACWI (Net, AUD). It was a falling month for markets, and an uneven one. Communication Services fell 13% in the index and semiconductors fell hardest of all, as investors sold the companies building AI on the worry that the spending is running ahead of the returns. Artrya was also one of our largest detractors, after its quarterly update withdrew the target date for FDA clearance of its Flow product, though we are still confident this is just a delay. The Australian dollar also rose against the US dollar, the euro and the yen, and that currency move accounts for more than half of our fall.
Our AI-build holdings (Meta, SK hynix, NVIDIA, Kokusai, Marvell and Broadcom) cost us about 3ppts between them. Crocs, Eli Lilly and Freee won almost 2ppts of that back, and the data owners we wrote about last month recovered what September’s rate shock had taken.
The best evidence yet that AI can pay for itself arrived in the same week the market sold the builders hardest.
Anthropic: someone is making money from AI
For three years the bear case on AI spending has been that nobody downstream makes any money. In August we asked who is actually earning a return on the build-out, and concluded that the chipmakers clearly were, the data centres were earning roughly their cost of capital, and the missing piece was the labs paying for it all. On 26 October Anthropic filed its prospectus, the first audited look inside a frontier lab, and filled in that piece.
We wrote about the filing in detail in our Livewire column. Revenue was US$4.6 billion for all of 2025 and US$11.6 billion in the June 2026 quarter alone, which was also its first quarter of operating profit. It has raised US$141 billion and still held US$132 billion at the end of June. Each dollar of compute now earns about two dollars of revenue, up from about 40 cents six quarters ago. The revenue is outrunning the compute bill.
The filing puts Broadcom at the centre of Anthropic’s next wave of capacity: Anthropic has committed to about US$161 billion of non-cancellable rent on Broadcom-built TPU systems, the largest single compute commitment in the prospectus, and Broadcom has made available up to US$42 billion of loans that can only be used to pay that rent. Anthropic is also the end user of Hut 8’s River Bend campus in Louisiana, about a quarter of Hut 8’s contracted data-centre rent, and press reports link the filing’s US$35 billion agreement with Lambda to Hut 8’s larger Texas campus. We added to Broadcom and opened a small position in Hut 8. NVIDIA, SK hynix and Kokusai are the other holdings whose customers have just shown they can pay.
The filing answers the demand question and opens a financing one. Anthropic’s own suppliers lend it money and also sell it much of what it buys, and October’s sell-off was the market pricing that question across the whole sector: Meta announced a US$97.5 billion capital raise, Alphabet’s free cash flow was negative for a second quarter, and CoreWeave’s credit spreads widened. We think the demand is real. What worries us now is the financing, and how long the returns take to arrive, and we’re doing the work to make sure we’re ok with this and where the builders are going.
AI’s winners and losers in advertising
If Anthropic showed that AI can make money, October’s advertising results showed who else is making it, and who is paying for it.
Meta’s advertising revenue in the September quarter was US$63.1 billion. Google Search earned US$63.4 billion. Three years ago Meta’s advertising was 70% the size of Google Search and now it is effectively the same size and growing twice as fast (26% against 12%).
The reason is AI. Meta sells attention inside its own apps, so better AI means better-targeted ads on space it already owns. The number of ads Meta showed rose 10% in the quarter but the price advertisers paid for each one rose 14%, which is what happens when ads work better. On its call Meta pointed to specific gains: its new ranking model lifted app-install conversions by 9.6%, and advertisers who followed its AI assistant’s suggestions got almost 5% more conversions at the same cost per conversion.
Google is on the other side of the same shift. Search growth slowed to 12%, from 17% in June and 19% in March. The price of each click held up, but the number of paid clicks grew 8%, down from 13%, and Google’s chief business officer put it plainly: “the strong growth in AI Mode queries had an impact because of the lower monetization we were seeing in AI Mode.” Google’s response is fair: query growth is the fastest in five years, most AI Mode questions are new rather than replacements, and it has only just started putting ads in AI answers. But in our September quarterly we wrote that an agent doing the searching “skips the results page where Google is paid”, and that Google has the most to lose. This is the first quarter where Google’s own numbers show the cost.
The sites that lived on Google’s traffic are feeling it more. Reddit said search referrals had fallen by more than a million a week in October and that daily users could fall by a low-double-digit percentage this quarter. Its CEO was blunt: “AI Mode does not drive traffic… It used to be a traffic driver, now it’s not.” The shares fell 29% the next day.
Meta’s share price didn’t follow its advertising. The shares fell this month, making Meta our largest detractor, on the cost of the build-out and the size of the capital raise rather than anything in the ads business, which had its best stretch in years. Muse, the consumer agent we wrote about in September, passed 10 million set-ups in its first six weeks. We made the long case for Meta in the September quarterly, and October’s results added evidence to it and we are excited about our Meta position.
The data owners came back
The other AI winners were the companies that own the data AI needs. Thomson Reuters, RELX, S&P Global and MSCI all rose between 16% and 21% and added about 0.7ppts, after costing us 0.3ppts in September’s rate shock. The evidence came with the rally. RELX said adoption of its AI legal platform had passed 50% in the US, S&P Global raised its revenue and adjusted earnings guidance for the year, and Moody’s said use of its research inside customers’ AI tools rose more than tenfold in three months. An AI answer is only as good as its source, and customers are paying the people who own the good ones.
Crocs and Lilly: the portfolio is more than AI
Our two best contributors this month had nothing to do with AI, and between them added about 1.4ppts.
Crocs rose 28% this month, almost all of it on 29 October, the day of its result. Earnings per share came in at US$3.69, against guidance of US$3.20–3.30 in July. HEYDUDE, the brand that had been dragging on results, grew for the first time in seven quarters, and management raised its outlook for the year.
Eli Lilly reported the same day and rose 7% on the result, and 23% over the month. Revenue grew 39% and it raised its full-year guidance by US$5.5 billion at the midpoint. Foundayo, its new GLP-1 pill, sold US$184 million in its second quarter on the market, nearly double the first, and Lilly says about four in ten patients starting an oral obesity pill now choose it.
We didn’t buy either as a hedge against AI but part of the appeal of these companies is the diversification they bring. We own them because we thought the market was underestimating them, and October’s results said the same. In a month when the AI trade fell hard, it helped that neither depends on it.
What is profitable is wealth
Most of October came back to who pays, and for what. Anthropic’s customers are paying for intelligence, enough for its revenue to outrun its compute bill. Meta’s advertisers pay 14% more for each ad because the ads work better, while a search on Google is worth less once an AI answer sits at the top, and Reddit’s traffic dries up when Google stops sending it.
More than 2,300 years ago, Xenophon recorded Socrates arguing in Oeconomicus that something is wealth only if it benefits the person who owns it. His example was a flute, which “may be wealth to him who is sufficiently skilled to play upon it, but the same instrument is no better than the stones we tread under our feet to him who is not so skilled.”
The market spent October questioning the economics of AI. Anthropic’s customers and Meta’s advertisers have shown that the demand is real, but demand alone doesn’t guarantee a return. The question now is who knows how to play the flute: who captures the value, and whether those spending hundreds of billions to build it will earn enough to justify the investment. AI’s value is becoming clearer but who gets to keep it, not so much.